Endless Improvements

العربية

Lubricant’s Oxidation Indicators
There are many used oil analysis tests that used to study the lubricant’s oxidation:
1. Increasing Viscosity [ASTM D445].
2. Increasing Acid Number[ASTM D974].
3. Fourier Transform Infrared (FTIR) Oxidation [ASTM D2412].
1. Viscosity:
As the oxidation byproducts, the median density of the molecules increases. This results in increased viscosity. Viscosity can be measured using dynamic or kinematic methods.
a. Dynamic (Absolute) Viscosity:
Viscosity is the measure of internal friction in a fluid. Viscosity and its dimensions are best explained with a model of parallel layers of fluid which could be viewed molecularly as below:
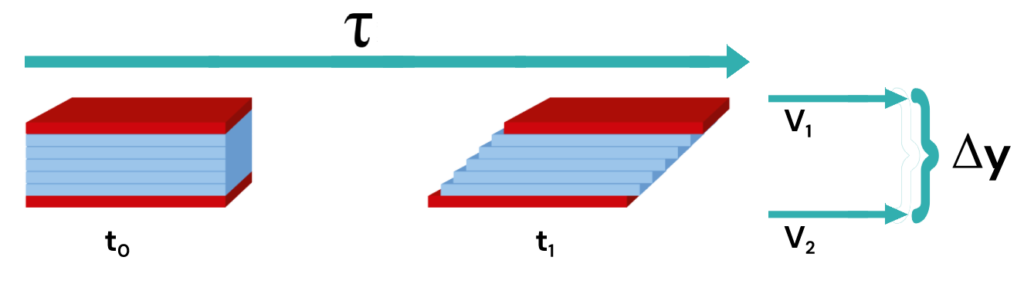
If this packet of fluid layers is sheared ( ), the individual fluid layers are displaced in the direction of the shearing force.
The upper layers move more rapidly than the lower layers because molecular forces act to resist movement between the layers.
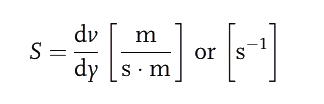
The difference in velocity between two given fluid layers, related to their linear displacement, is referred to as shear rate (S).
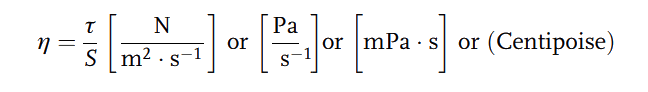
This velocity gradient [S] is proportional to the shear stress (). The proportionality constant ( ) is called Dynamic Viscosity.
b. Kinematic Viscosity:
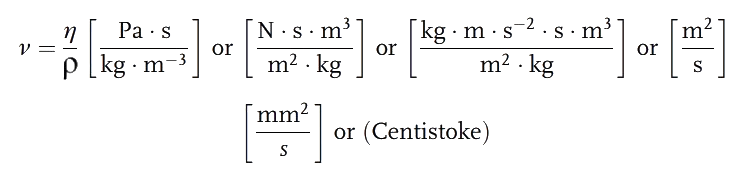
The laboratory determination of viscosity in run-out or capillary tubes is influenced by the weight of the fluid. The relationship between dynamic viscosity () and specific gravity ( ) is referred to as kinematic viscosity (v).
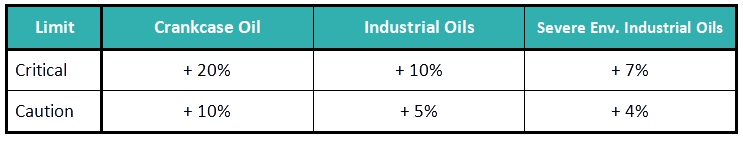
The Viscosity Limits:
2. Acid Number:
Acid Number is the measure of acid concentration in a lubricating oil. The Acid Number does not measure the oxidation rate, it merely measures the by-product of oxidation. Acid Number is determined by the amount of potassium hydroxide required to neutralize the acid in one gram of an oil sample. [mg KOH/g].
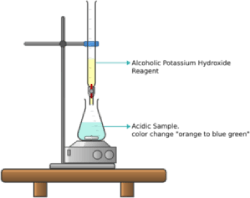
a. Colorimetric Titration ASTM D974:
The sample is dissolved into a mixture of toluene and isopropyl alcohol containing water and indicator [the mixture’s color is orange].
Add 0.1 M KOH solution in increments and mix to disperse the KOH as necessary.
Titrate till the end point [the orange color changes to blue green color].
This test is used on oils that are not excessively dark.
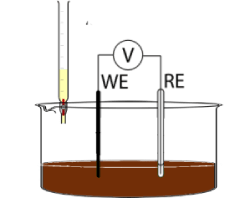
b. Potentiometric Titration ASTM D664:
The sample is dissolved into a mixture of toluene and isopropyl alcohol containing water.
Add 0.1 M KOH solution in increments and mix to disperse the KOH as necessary.
Titrate till the end point [the potential changes less than 5 mV/0.1 mL KOH].
This test is used on oils that are excessively dark.
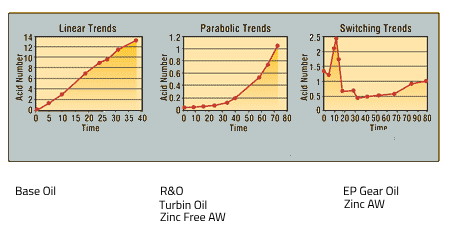
Common Trend of Acid Number:
Linear trends: It represents the linear oxidation of the base oil.
Parabolic curves: may characterize rust and oxidized (R&O) oils. The AN remains constant during the additive depletion induction phase. Once the R&O additives have depleted, the base oil will begin to oxidize.
Switching trend: representative of EP oils, where some of the additives are acidic. As additives deplete and react, the AN varies. These effects make it hard to trend EP oils unless the normal switching pathway is known in advance.
Acid Number vs. pH:
The acid number only indicates the acid concentration.
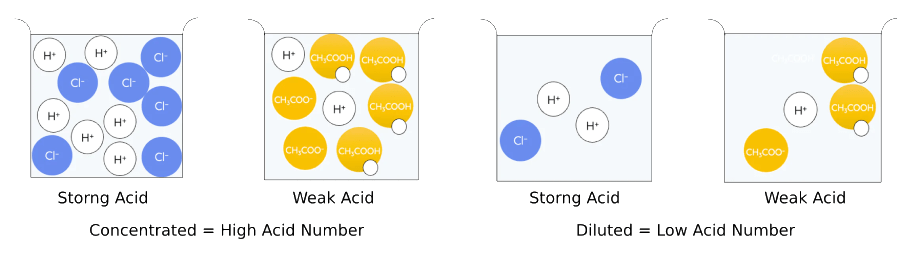
pH represents the concentration of hydrogen ions, which indicates of how corrosive the lubricants may be.
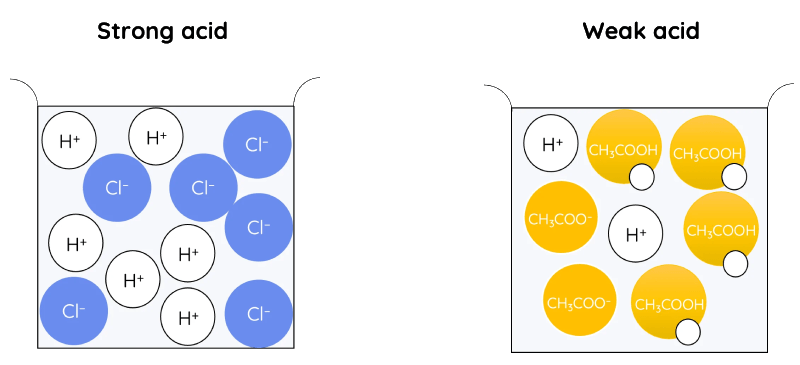
Strong Acids: fully dissociate in water.
Weak Acids: partial dissociate in water
3. Fourier Transform Infrared [FTIR]:
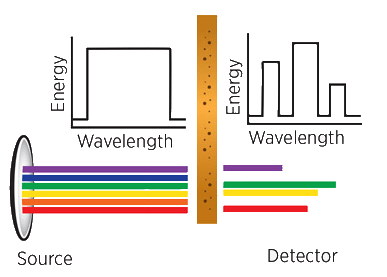
When exposed to infrared radiation, sample molecules selectively absorb radiation of specific wavelengths which causes the change of dipole moment of sample molecules.
Consequently, the vibrational energy levels of sample molecules transfer from ground state to excited state. The frequency of the absorption peak is determined by the vibrational energy gap. The number of absorption peaks is related to the number of vibrational freedom of the molecule.
The intensity of absorption peaks is related to the change of dipole moment and the possibility of the transition of energy levels. Therefore, by analyzing the infrared spectrum, one can readily obtain abundant structure information of a molecule.
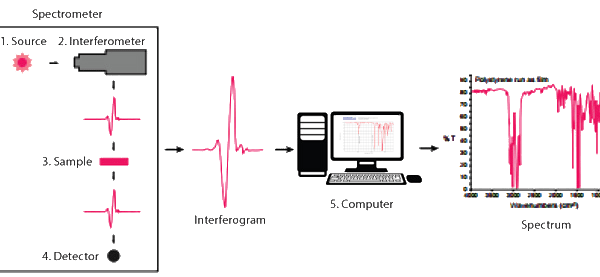
The source emits infrared energy and send it through an aperture to control the amount being presented to the sample.
The beam enters the interferometer where it is “encoded” using a series of stationary and movable mirrors. This encoding is a way to produce a signal that consists of all the important infrared frequencies simultaneously.
The beam then enters the sample, and certain frequencies of the energy are absorbed. The energy that escapes the sample is sent to the detector where it is measured.
The measured signal is then sent to a computer where Fourier transformation takes place.
Fourier transformation is a mathematical process where a waveform can be broken into an alternate representation for easy viewing.
At this point, the results are plotted on the screen, and a simple analysis can be made by the technician.
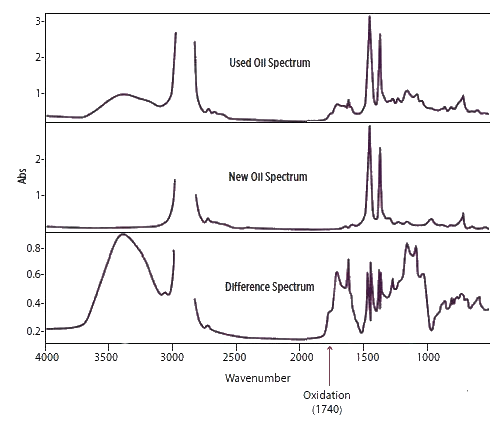
FTIR Analysis of Used Oil Sample:
It is a three-stage process:
The First stage: is to record the FTIR spectrum of a new oil sample to obtain a baseline FTIR trace.
The second stage: is to record the same FTIR spectrum of the used oil sample.
The third and final stage: is to subtract the new oil baseline, often referred to as the new oil reference, from the used oil spectrum to obtain the difference spectrum.
Oxidation is represented by an increase in a peak centered around 1740 cm-1
Oxidation Trend Using FTIR:


Facebook Comments